


1
2
3
4
5
6
Game-flow Chart
The chart illustrates the first draft of everything participants will see during a playthrough.
Gameloop Diagram
Shown is visualization of what core gameplay would be like. This method allowed for rapid iteration during this phase of development.
Visual Prototype of the Environment
The graphic shows an early draft of the field layout, that was tested in the pen & paper prototype.
Pen & Paper Prototyping
I asked colleagues to help me test my designs and assumptions on paper.
Pen & Paper Prototyping
Most modifications to the game layout and its rules happened in this stage. No big changes in design were necessarcy, once I started executing my ideas in the engine.
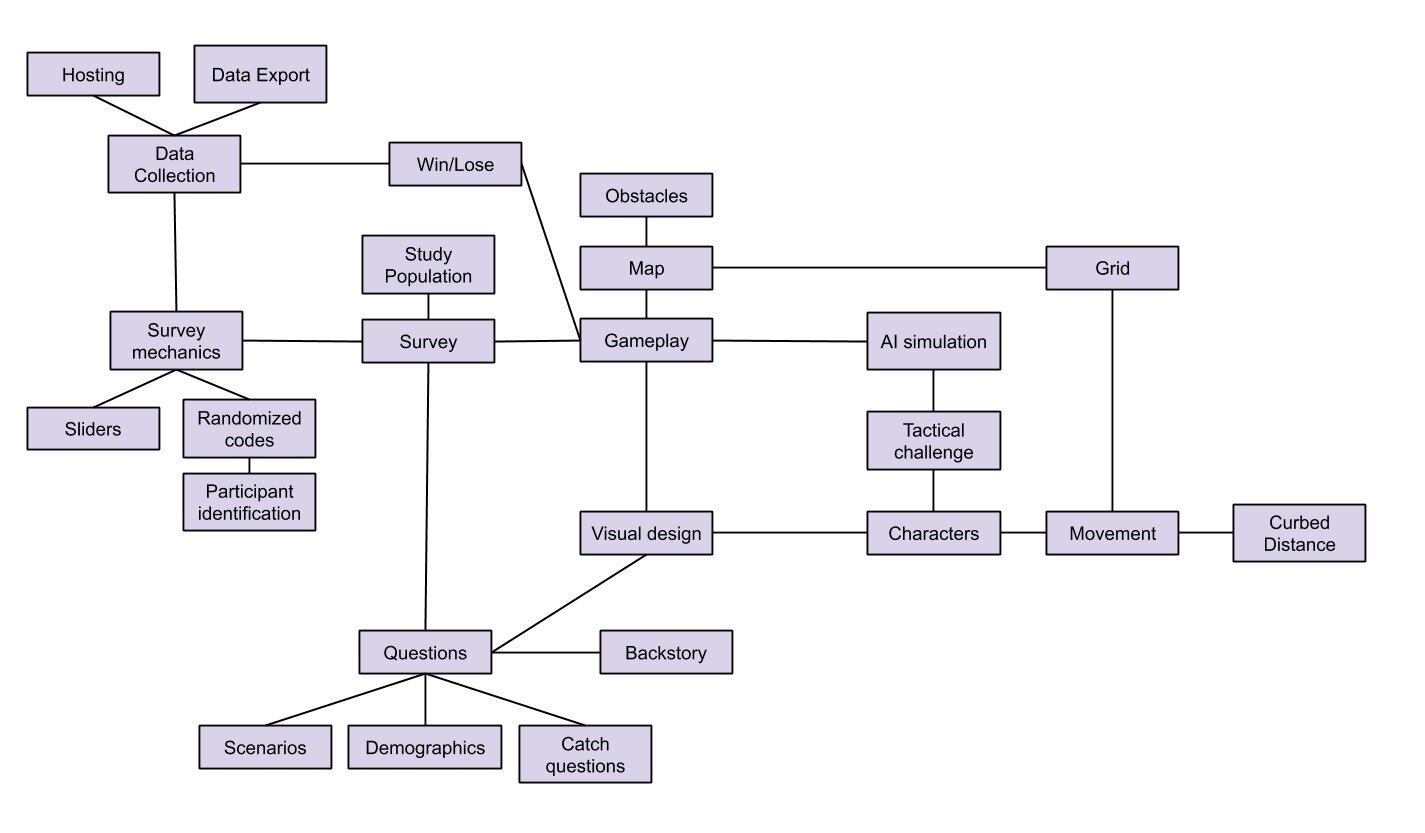
Core Diagram
Before starting implementation, I created a diagram of all important aspects I needed to keep track of during development. This allowed for easy planning and effective time management.